Convict Bodies: An exploratory data analysis of a nineteenth-century language of coercion
Primary tabs
Across multiple historical contexts, we encounter a recurring fantasy: using language to conjure an image of a person out of place to enable the apprehension of said person in real life. An especially fantastical version is encountered in the otherwise middling James Bond movie For Your Eyes Only (1981), in which the protagonist, played by Roger Moore, encounters a villain unknown to him. Later, at MI6 headquarters, a clerk suggests to a somewhat baffled Bond that he go into “the identigraph room”. Q, played by Desmond Llewelyn then in his late 70s, leads Bond into a computer lab and places him in front of a monitor, by early eighties’ standards sizable. Q then hunches in front of a computer and asks Bond to describe the man he encountered. Bond provides a series of generic descriptors (“caucasian”, “brown hair”) while Q enters the data. A face, rendered as a simple line-drawing, appears on the monitor. At one point, the nose grows comically large, suggesting that Q does not yet fully master the software. Bond adds: “glasses”, and a set of spectacles appears on the screen; “octagonal”, Bond adds, and the glasses change shape. In the end, Q presses a button, and a dot matrix printer starts printing an image of Emile Leopold Locque, a Belgian henchman and murderer, who, according to Bond, has “escaped from Namur Prison by strangling his psychiatrist. He has worked for drug syndicates in Marseilles and Hong Kong. Now reported working for Greek smugglers.” Now, the hero knows whom he is chasing. Technologies for identifying wanted individuals through language and drawing go back centuries, but at the time, the scene and the otherworldly powers it ascribed to the computer appear to have been inspired by technologies for creating images using composites of different photos, so-called photofit. 1
This essay is about such fantasies in early nineteenth-century Copenhagen and attempts to craft a system for identification of convicts escaping from a Copenhagen prison, known to its contemporaries as the Stockhouse Slavery or simply the Slavery.2 The essay presents an exploratory analysis of a dataset of about 1500 unique convict descriptions of men, as only men were subjected to this form of convict labour. The dataset is available on this platform.3 The originals are found in the Danish National Archives in Copenhagen. The essay is the collective product of a digital history class held at Aalborg University in the autumn of 2021. The class was taught by Johan Heinsen for fifth-semester students in the BA-programme in history. The class consisted of 7 workshops in which we first used Transkribus to digitise a corpus and subsequently explored the data presented here with methods inspired by social data science.4 We worked in the programming language R.
Why did the state record the appearances of penal slaves?
Convict escapes from the early modern penal institutions known in Scandinavia as slaveries were a frequent occurrence. As presented elsewhere, upwards of 20 percent of all convicts ran at least once during their sentence to penal labour.5 The many escapes were possible because convicts worked on fortifications and building sites across the city, i.e., outside the slaveries. In this manner, the productive aims of the institution created a regime of labour that allowed illicit exit.
From the early eighteenth century onwards, a customary bounty was paid to anyone who apprehended prison breakers and army deserters. By the mid-eighteenth century, it became increasingly common to advertise both groups, along with runaway servants and other workers or subjects, in newspapers. As shown by Anders Dyrborg Birkemose, this nascent surveillance technology evolved.6 Over the next 100 years, the administrators of the Copenhagen Slavery and of slaveries elsewhere in Denmark were among the most steady advertisers. An advertisement typically described what the wanted person looked like. Until 1807, these descriptions seemingly had to be recorded once an escape happened, but not all escapes were advertised. An order to fortress commanders from 11 April 1807 required that all convicts in the slaveries should have their appearances recorded for the express purpose of advertisement.7 The order also stated that when a convict ran, his likeness should be advertised in the newspapers and in letters directed at the authorities wherever the convict originated.8
Each description consisted of two or three elements. First a note about when the convict had arrived, his place of birth, and his age. Sometimes his height was noted, typically in inches. Then followed a set of standard phrases concerning the man’s appearances: the shape of his face and its most prominent features, proportions of his body and limbs, hair and eye colour. The third element, which was sometimes omitted, listed singular identity markers. An example of a description containing all three elements is that of Johan Didrik Eskildsen:
ORIGINAL: indkom i Slaveriet den 5de November 1831 föd i Kjöbenhavn, 31 Aar gammel. Middel Væxt, spinkel Legems bygning, blaae Øine, mörkt Haar, Paa hans höire Arm er udstukket et Meneske-Hoved, en Havfrue og Bogstaverne IDDS og D. E. S. Paa den venstre Arm et Meneske-Hoved et Flag og Bogstaverne K E S og S E. S. Paa den höire Kind tet ved Munden har han et Ar.
TRANSLATION: Arrived in the Slavery on 5 November 1831, born in Copenhagen, 31 years old. Average height, slender build, blue eyes, dark hair, on his right arm a human head, a mermaid and the letters IDDS and D. E. S. On the left arm a human head, a flag and the letters K E S and S E. S. On the right cheek close to the mouth he has a scar.
A polyglot community
The fact that we can map each description to the birthplace of the individual allows us to explore the corpus in a non-linear way and to generate questions about how bodies of people of different ethnicities were recorded. Such an interactive map is shown below, made using the Leaflet library. Only places that were easily located have been tagged. Based on a string search using the function str_extract() and a RegEx pattern, the place names were extracted from the texts automatically. The standardised structure and phrasings meant that almost all places could be automatically extracted from the text in this way. However, due to the idiosyncratic spelling of place names, each place extracted had to be assigned coordinates manually. We did this collectively as part of a workshop. Because we knew from the start that we would be unable to tag every description individually, places that occurred multiple times were prioritised. About 2/3 of the descriptions were tagged with birthplace coordinates, including all locations that appeared more than twice. A small amount of noise has been applied to space out individual points that would otherwise overlap.
A Language of Identification
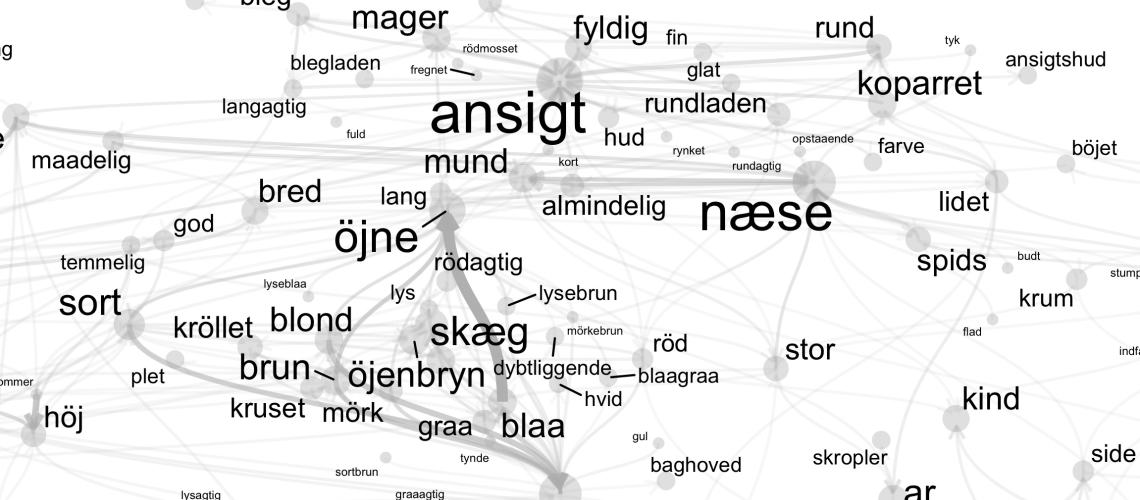
Convicts’ appearances were recorded at entry as part of a ritual that also involved putting them in chains and uniform to render them recognisable. In this sense, it was a transformative ritual, marking a threshold at which they were primarily defined by their penal status. The standardised language of the descriptions fits this reductive gesture, and the recording of appearance was part of the production of a convict body to be immobilised and coerced into labour. We can use the sources produced as part of this ritual to get a sense of what counted as effective bodily markers of identification at this particular threshold. To develop a sense of this language, we visualised the combined texts as a network of words based on their immediate proximity in the text. Thus, this distant reading begins by breaking each text into bigrams, i.e. word pairs, using functions from the Tidytext library. To effectively pinpoint the parts of the text that convey specific meaning, we need to apply a list of stop words to filter out common but non-informative parts of the corpus such as pronouns and articles. We also apply a dictionary to standardise variations in spellings. Both lists were produced over multiple iterative steps of visualisation and tweaking, and the resulting network of words should be easier to read. The visualisation can be thought of as an experiment in how to read an entire corpus of 1438 texts as one and to get a sense of the variations of descriptors linked to the common elements of the texts. It also suggests structural features of the language in the records. Below we show the original Danish text and a version in which each token has been translated.

Figure 2. Danish network
Some phrases were difficult to translate, and small differences were sometimes lost, but below is an approximate translation:
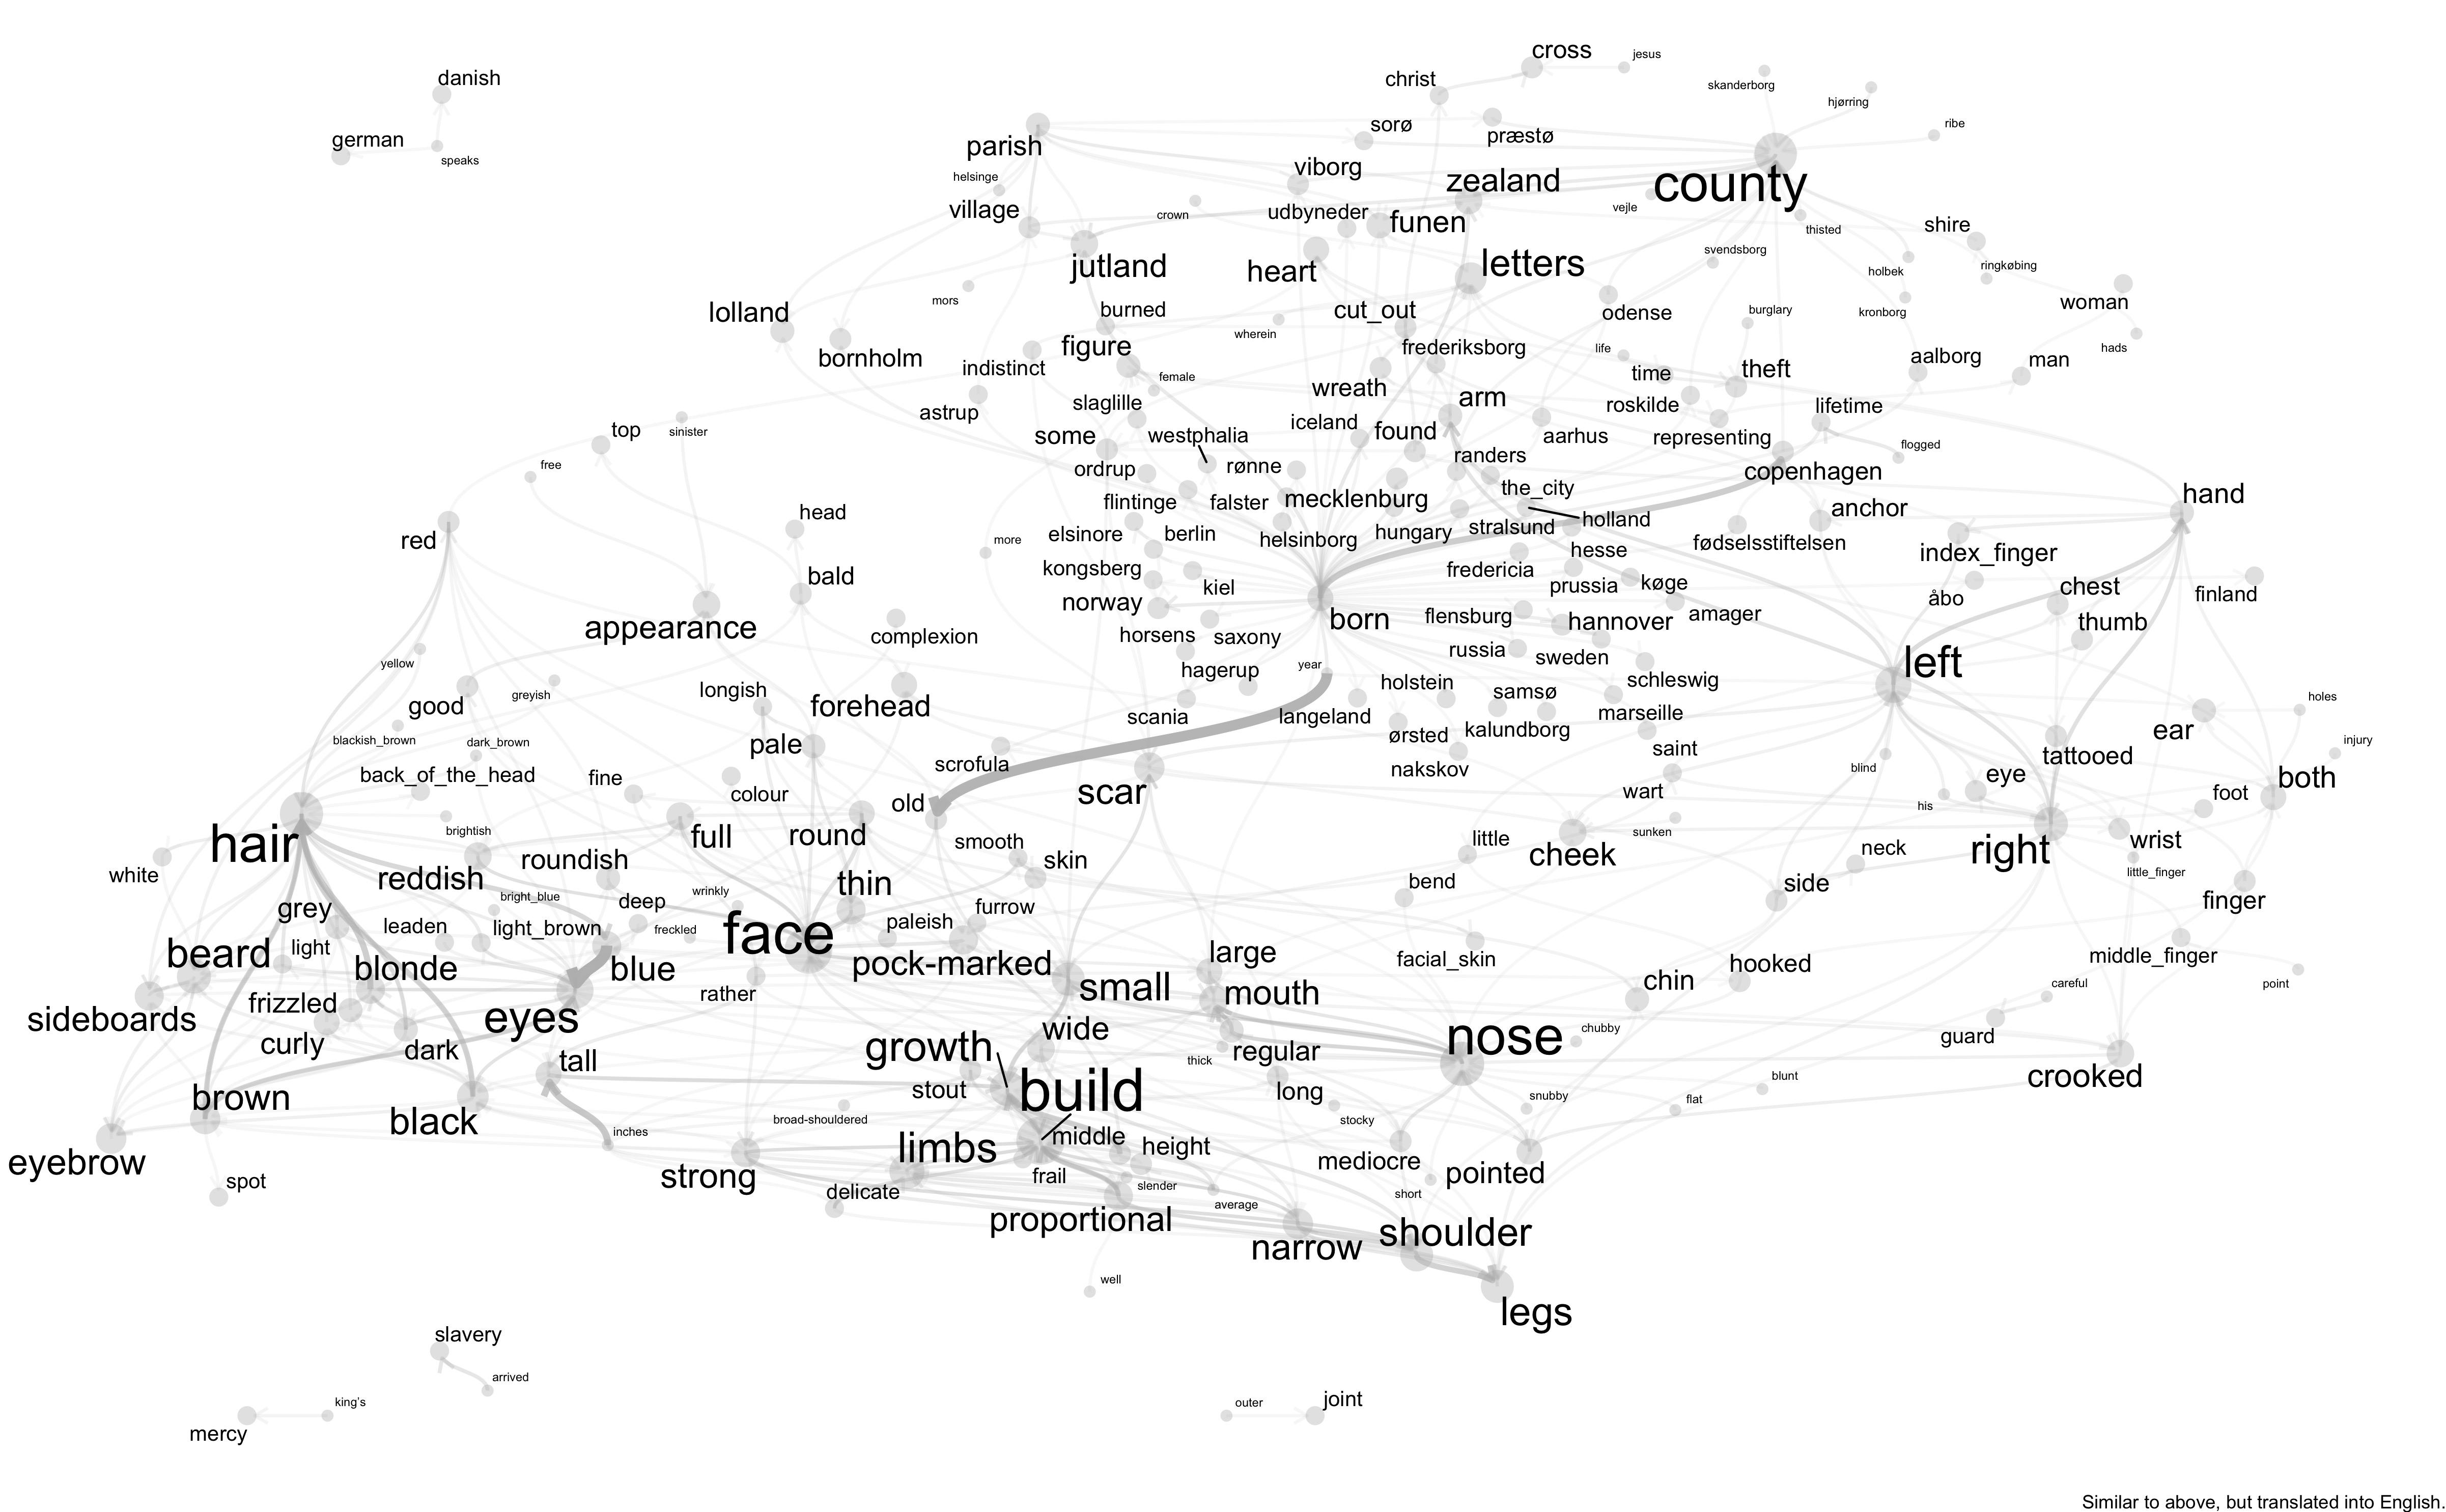
Figure 3. English network
Convict bodies were described in a language with limited variation. For instance, faces were smooth or scarred from smallpox; round, full, thin or narrow; “red” or “pale”. The handful of descriptions of black or brown bodies default to racist stereotyping. Eye and hair colour were recorded along with descriptions of the shoulders, limbs and overall proportions of the person, often with qualifiers such as average, small, tall, strong or thin. Visualising the entire corpus in this way also forces us to think about absences. Surprisingly, teeth were almost never mentioned, perhaps because bad teeth were not an efficient marker of visual identity in an early modern society, but this is only a hypothesis. More easily explained is the absence of clothes. Descriptions of clothing were an integral part of runaway advertisements in the period, partly because clothes were expensive and therefore difficult to change, but also because appearances were clearly tied to status. However, convicts in these types of prisons wore standardised uniforms that marked them out to onlookers. For this reason, it was assumed that they would have already altered this part of their appearances once the advertisement was published. About half of all convicts had their height noted in inches, but this part is filtered out to make the graph readable. On average, ex-soldiers were almost five inches taller than civilians. The descriptions also noted the birthplaces of the person, duplicating information from the inmate registers.
Finally, and perhaps more interesting, the descriptions noted specific information in a different language than the generic descriptors of eyes and proportions. They noted peculiarities such as tattoos or scars, sometimes suggesting fragments of narratives in initials, dates and hearts, religious iconography such as Christ or crucifixes, or maritime or military symbols such as anchors or weapons. To an extent, tattoos were tied to occupational background. 13.3% of descriptions of sailors noted tattoos in contrast to only 10.1% and 4.9% for ex-soldiers and civilians respectively. Interestingly, 17.3% of former convicts had tattoos, suggesting that some tattoos were prison tattoos. In any case, tattoos graphed the past unto bodies that would otherwise be rendered similar by the chains and uniforms. Similarly, descriptions of scars added biographical snippets by sometimes suggesting how the scar had been inflicted, such as “saber cut”, and made the individual identifiable. In that sense, the markings of identity visible on the body itself was recorded to prevent a return to such identities. While tattoos on the chest were sometimes recorded (this is where Christ went), almost all other signifiers were located on the faces, arms or hands. This made sense, since the onlooker that was to be mobilised by the description was most likely to encounter the convict dressed. Thus, the descriptions emphasised visible elements. Crooked or otherwise impaired fingers are often described as a specific trait. However, a single graphic description of genitalia suggests that the convicts were completely undressed when their description was made.
Correlations
Due to the highly regular language of each description, detecting the presence of certain identifiers is relatively easily done using RegEx. We identified a number of such features that could be extracted automatically, including the mention of tattoos, fingers, scars, certain facial descriptors (scars from pox, smoothness, complexion, narrowness, width, length), descriptors of eyes and hair (typically colour), as well as any mention that the convict was “strong”, whether this applied to their overall constitution of specific parts of the body, such as arms. We automatically extracted mentions of height and age, which were recorded numerically and then transformed into categorical variables based on quantiles.
Ultimately, each individual description was turned into a set of categorical variables. It does not make much sense to think about this in terms of traditional, inferential or predictive statistics. We would not expect a clear predictor. Rather, we have a rather murky and unwieldy set of correlations that do not really suggest causality. To explore these correlations, we turned to multiple correspondence analysis (MCA). The point of MCA is to reduce the complexity of a dataset by mapping correspondences along a number of dimensions, understood to be latent variables that might explain the explicit variables. One might think of it as an alternative to producing every possible contingency table. Crudely speaking, MCA suggests to us which variables go together in their relation to the constructed dimensions. It is an exploratory tool that can generate hypotheses about the data. Each dimension produced by the calculation accounts for a descending proportion of the correspondences in the text. Typically, only the two dimensions that account for the highest proportions are visualised, because visualising more than two axes in a legible way is difficult. Due to the high level of variance in the dataset, the two axes account for only a small percentage of the variation in the dataset, but this is expected; after all, people look very different, and we would not expect much correlation between, say, scarring and hair colour. Yet, the visualisation still allows us to identify and consider certain patterns.
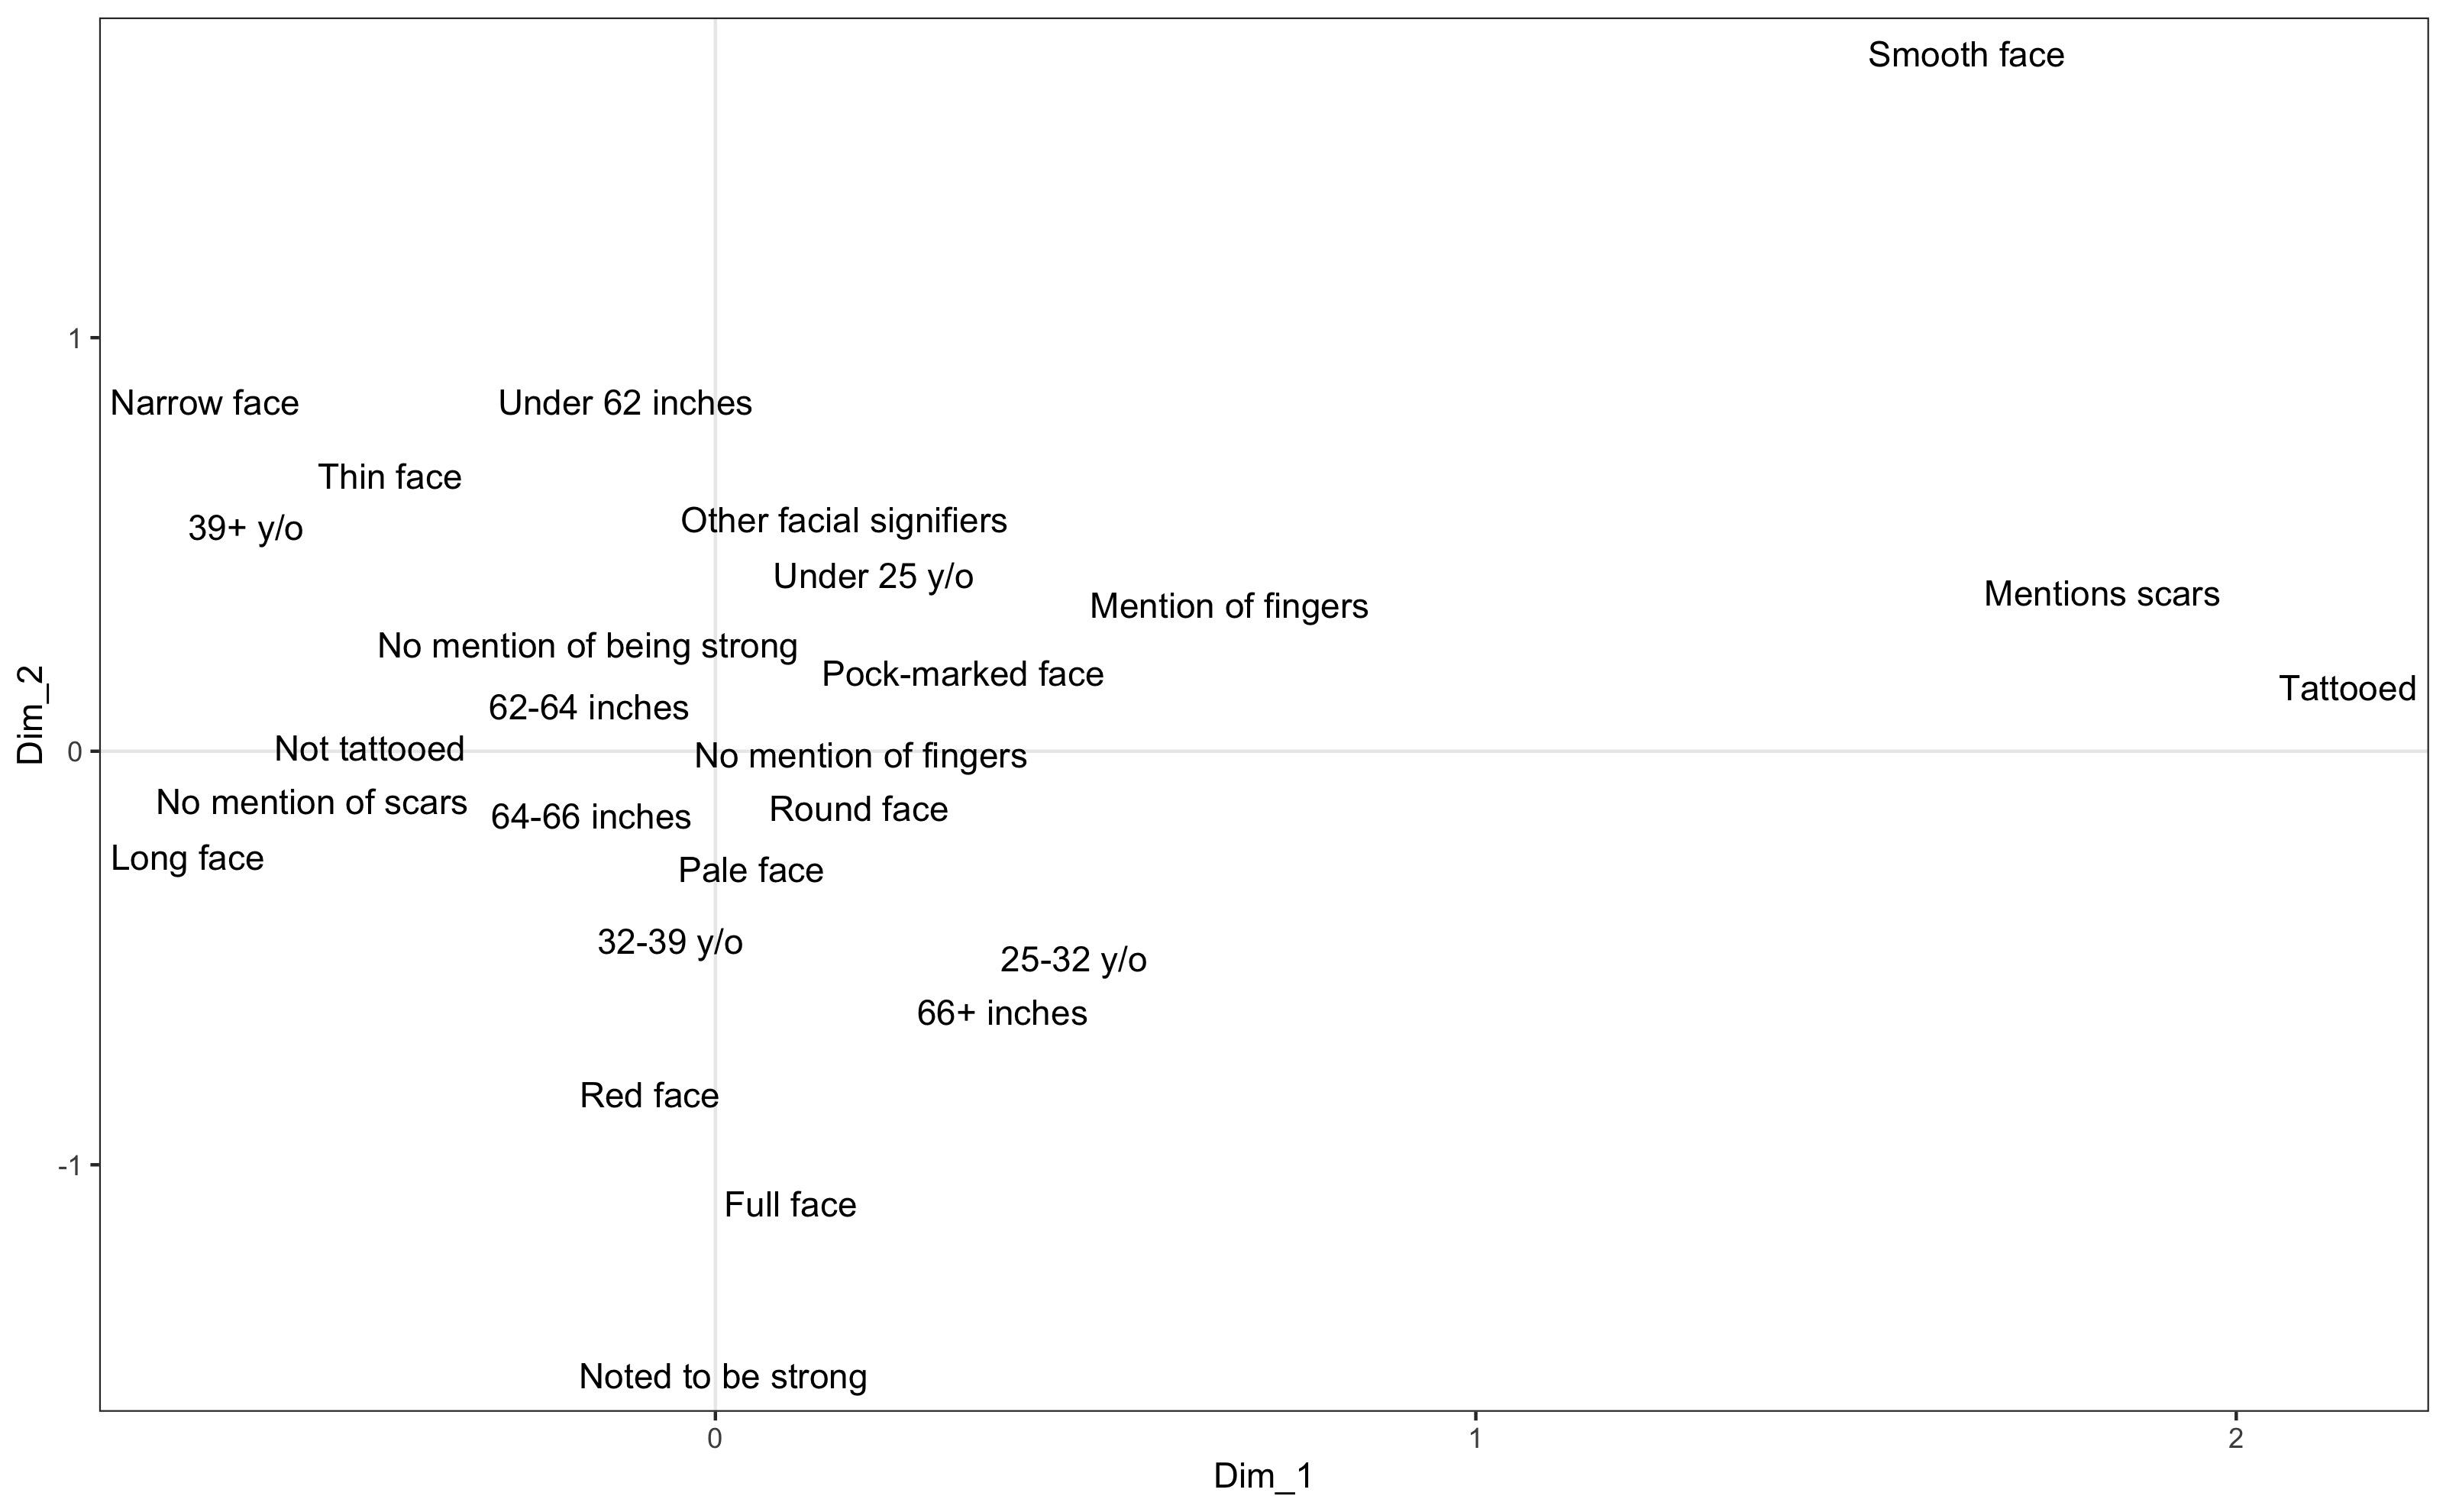
Figure 4. MCA
The dimensions, represented here as axes, are constructed based on the data. They have no pre-defined meaning but suggest that something in the data should be explored further. In this case, the dominant dimension (Dim 1) clearly relates to the presence of special identifiers. Thus, there appears to be a trend in the data that tattoos and scars are recorded together. This might suggest that certain arrivals received more scrutiny than others, indicating a hidden variable concerning attention to detail. Closer towards the centre of the plot, we encounter variables concerning fingers (another “unique” identifier) and young age. Possibly, younger convicts were recorded in greater detail, because they were expected to be more likely to attempt escape. This might also explain why a “smooth” face appears to sometimes correlate to the mention of tattoos and scars. Another possibility is that if a convict had one unique identifier, such as a tattoo, his body would receive more scrutiny, and the clerk might then notice scars and crooked fingers. The second dimension (Dim 2) appears to relate to the overall proportions and strength of the body recorded. Thus, tall convicts were also more likely to be noted as “strong”, and as having “full”, “long” or “red” faces. In contrast, short convicts would have “narrow” or “thin” faces. The latter also correlates to the oldest quantile (39+ years of age).
Conclusion
The text mining and visualisation strategies employed in this essay demonstrate some of the potentials of opening up a highly regular text corpus in order to facilitate exploration and hypothesis generation. It allows us to “read” many texts at once and to visualise variations. Such exploration can form the basis of new questions about what identity meant and how knowledge facilitated immobilisation. It might inform our understanding of how such knowledge production affected individual trajectories. Finally, it can help us understand how commoners at large gauged the appearances of strangers. After all, this was information meant to circulate. In the early nineteenth century, it was usually up to the imagination to turn this graphic language of identity into a mental image of a person who might then be recognised and apprehended. The occasional wanted poster and the emergence of photography bypassed this mental transformation. Yet, police forces around the world still regularly issue written descriptions of wanted individuals, often in a language surprisingly close to that of the early modern period.
As alluded to in the introduction, the advent of the computer transformed such fantasies. What if the computer could turn text into image? In a way, the visualisations produced in this text mimics this fantasy. Yet, it also erases the element of individuality that was key to a successful identification of a convict on the run, in favour of producing a general rendition of the data at large. As a final experiment, we might ask what the computer allows us to do if we mimic the original intent of the data. This would mean visualising an actual individual. Today AI can be used to produce realistic images of historical individuals based on their descriptions.9 Online tools such as the neural net of artbreeder.com allows for the production of fundamentally synthetic but (sometimes) lifelike 3d images. The following portraits were generated by feeding it descriptors based on two different convict recordings. The resulting 3d-renditions were touched up by Jamie Isabeau Helstrup Andersen in a style closer to the wanted posters as they might have looked in the nineteenth century. Of course, we cannot make any qualified estimation of their accuracy, yet it might alert us to the fact that a technology that in 1981 appeared to cinema goers as futuristic science is now available as a commercial product accessible through a standard browser. We no longer need Q’s science laboratory to produce an image of a person based on discursive descriptors.
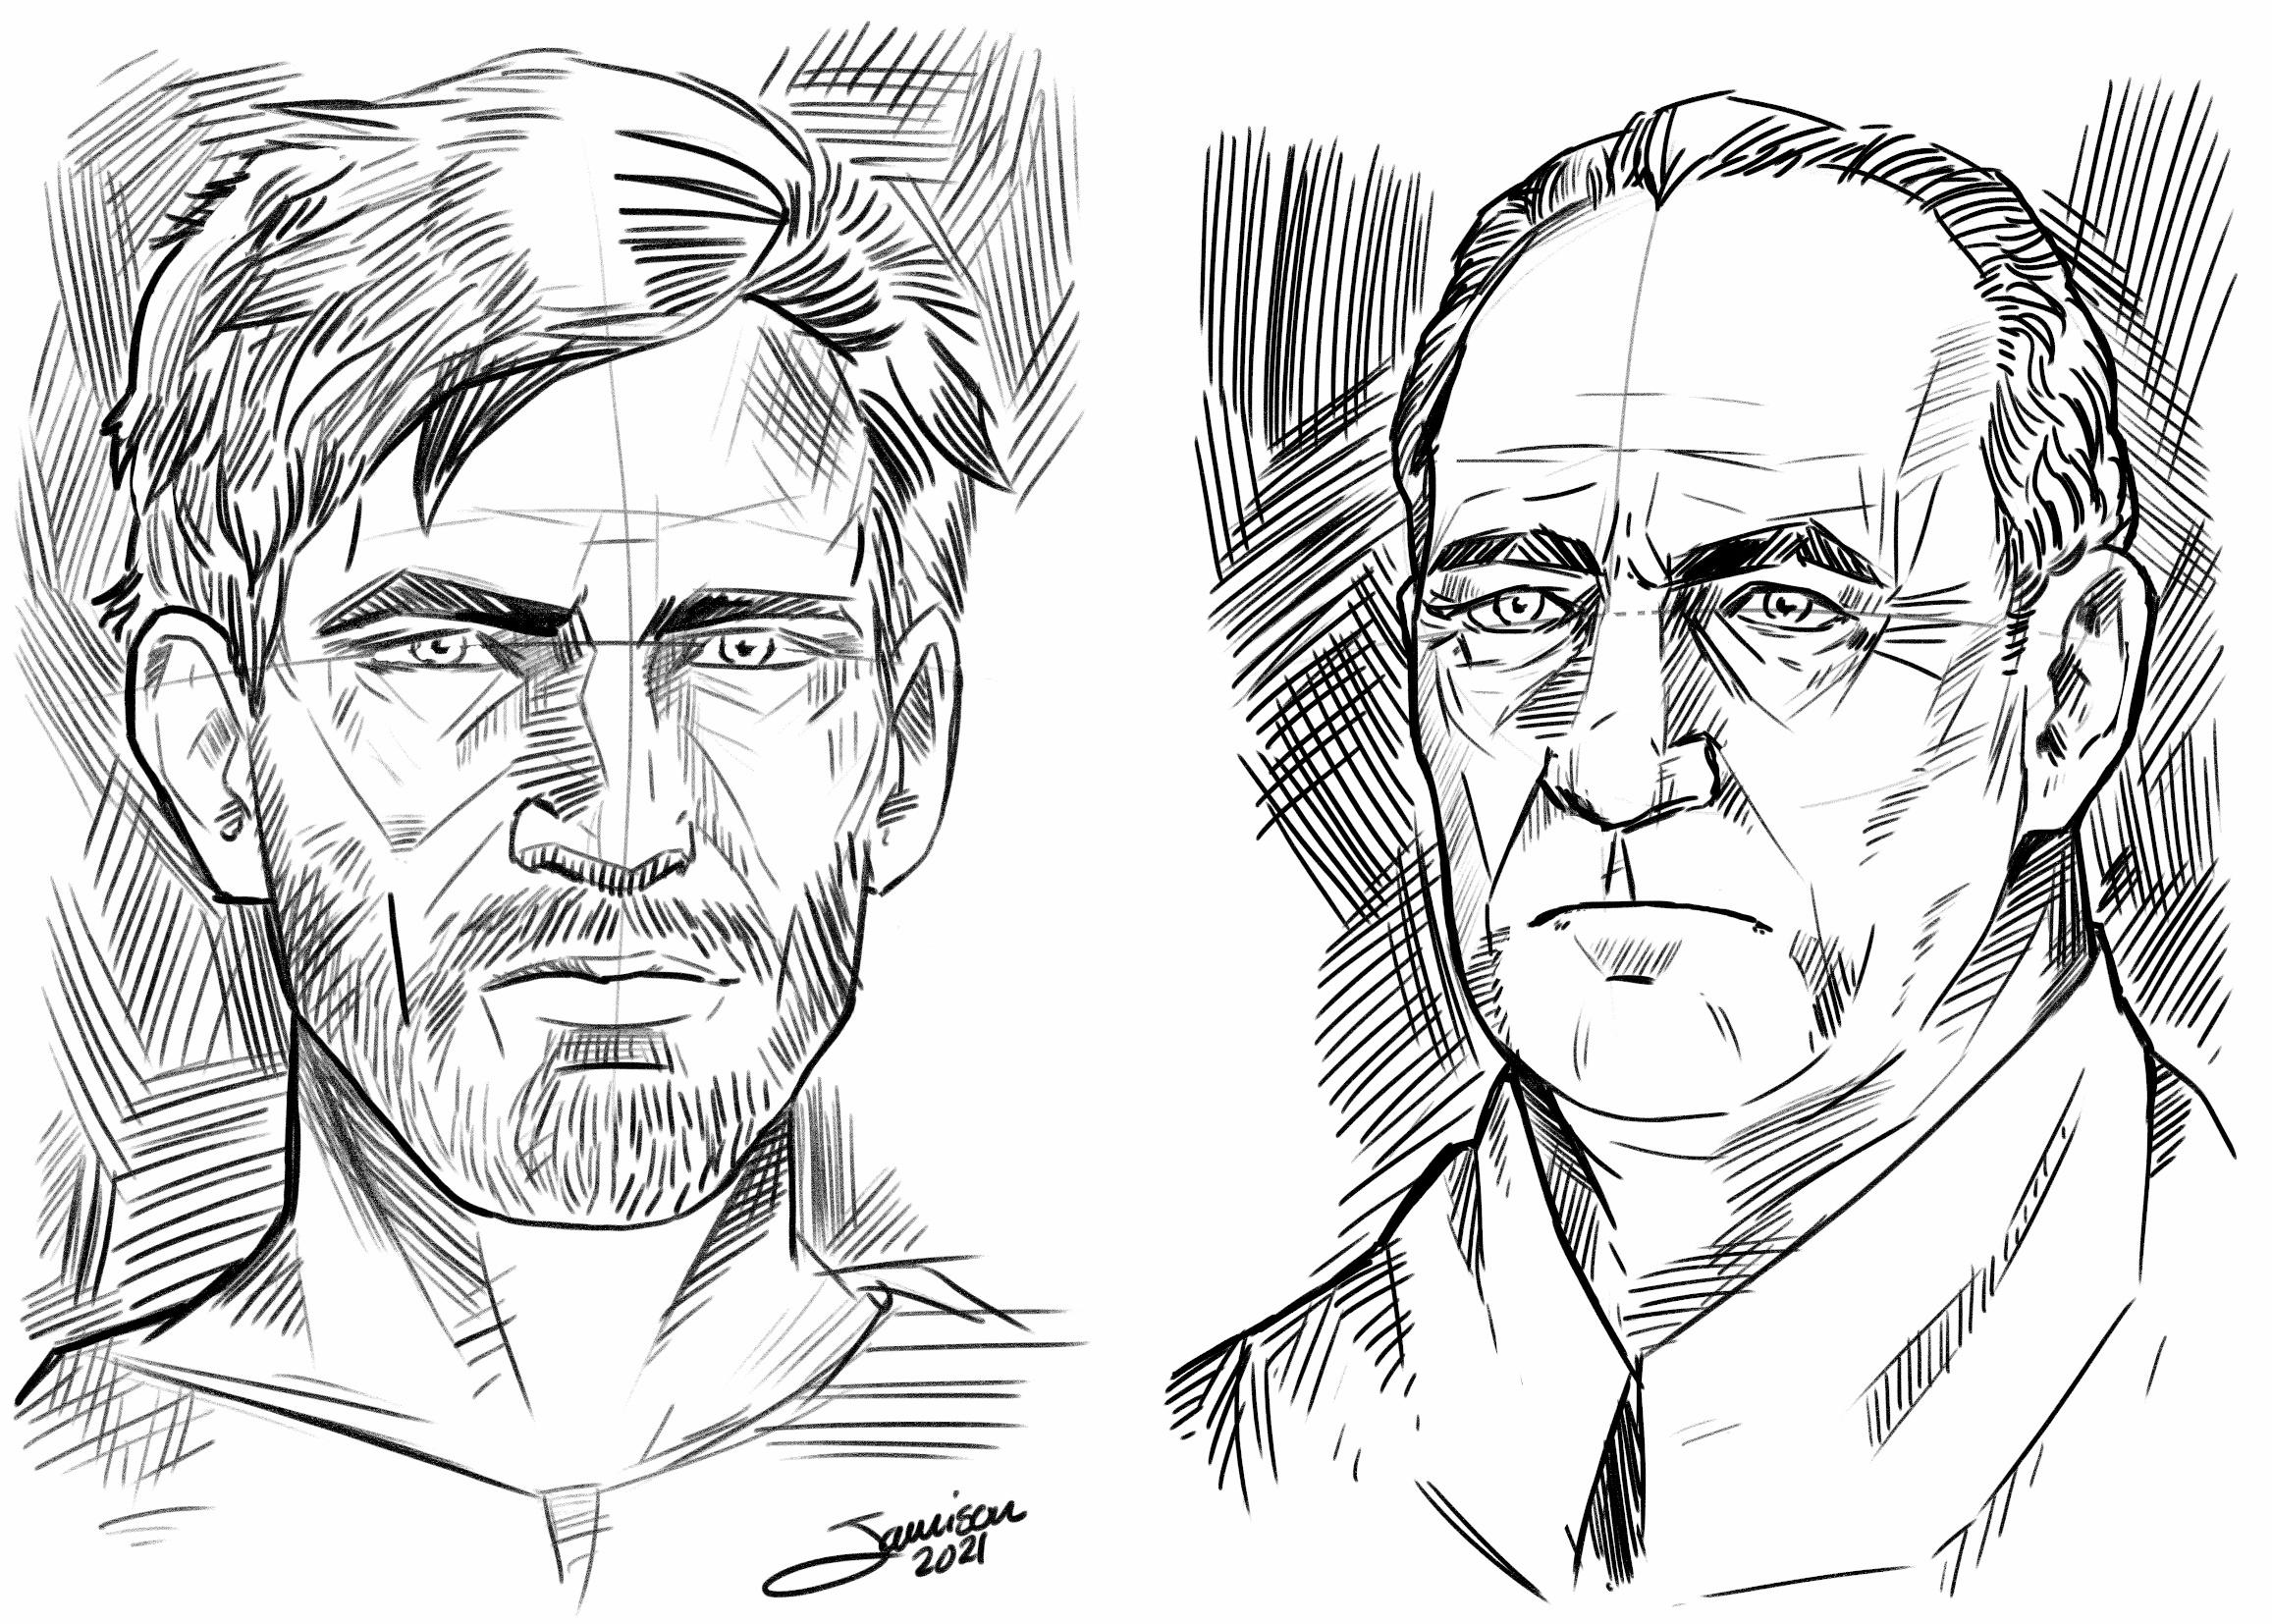
Figure 5. Drawings
2. For more on these institutions see Johan Heinsen, “Historicizing Extramural Convict Labour: Trajectories and Transitions in Early Modern Europe,” International Review of Social History 66:1, 2021: 111—133. https://doi.org/10.1017/S0020859020000498↩
3. https://dkan.worck.digital-history.uni-bielefeld.de/?q=dataset/book-convict-appearances-copenhagen-1807–1832↩
4. The Transkribus model used was a prototype of the 18th Century Danish model which has since been made publicly available.↩
5. Johan Heinsen, Det første fængsel (Aarhus: Aarhus University Press, 2018.)↩
6. Anders Dyrborg Birkemose, En Slaven Stær. MA-thesis, Aalborg University, 2022.↩
7. Rigsarkivet, Generalauditøren, Auditøren for Kronborg Fæstning, F.Slavesager, 1795—1805, Letter dated 11 April 1807 from the Generalitets and Kommissariatskollegium↩
8. A sample dataset of about 900 advertisements can be found on this platform, demonstrating the breadth of subjects that could be advertised besides convicts. https://ubib-sfb1288-appsrv03.ub.uni-bielefeld.de/?q=dataset/runaway-advertisements-eighteenth-century-copenhagen.↩
9. See for instance https://www.theverge.com/2020/8/21/21395115/roman-emperors-photorealistic-portraits-ai-artbreeder-dan-voshart ↩